2018年8月11日雅思小作文真题范文:柱状图
摘要:2018年8月11日的雅思小作文为柱状图,题目是:The chart shows the percentage of the total world population in four countries in 1950,2002 and 2050.请看本期小作文范文及解析。
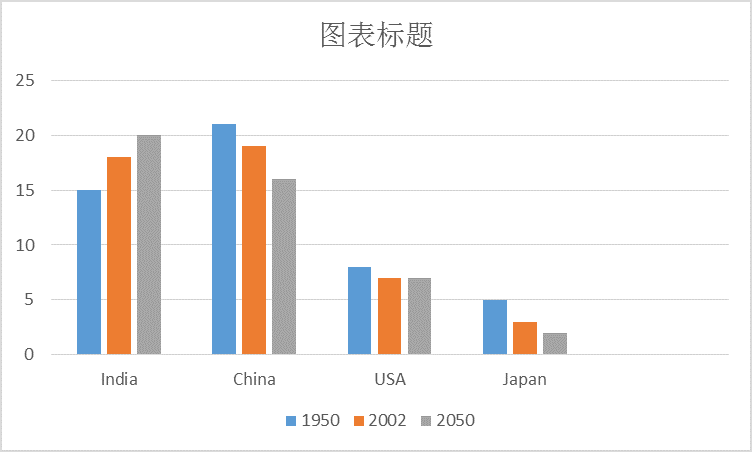
2018年8月11日的雅思小作文题目为:The chart shows the percentage of the total world population in four countries in 1950,2002 and 2050.柱状图,注意不同国家的人口变化,尤其是发达国家日本老龄化及人口锐减现象以及发展中国家中国、印度人口增长变化等数据。注意三个时间段的时态。
小作文范文解析:这次考试的图形是比较简单的动态柱图,对于考生写作的难度是不大的。要注意的基本问题有两个:一个分段的平衡和标准,二则是对于自己的总结的把握。对于6.5+的同学,则要更多的注意自己的对比和自己的主语的替换,更好的体现自己的词汇,衔接和语法多样。
小作文高分表达
Varied
out of four
most populated
accounted for
In light of downward
Remaining
dwelled in
over the same period
experience
雅思小作文范文
Provided is a bar illustrating how the proportions of populations in four nations taking up of the total world population varied with projection to 2050.
From the giveninformation, shares of three countries out of four are likely to drop except that of India which, meanwhile, in 2050 is to be the most populated one.
In 1950, china had the largest population compared to other countries with a proportion of nearly 25%, while the number of people living in India accounted for 15% of the world population. In light of prediction,figure for India is possible to increase to 20% in 2050; however, Chinese proportion is falling to 17% finally.
On the other hand, asimilar downward trend could be found in the percentages of populations for remaining two nations. For USA, around 7% of world population dwelled in this country in 1950, decreasing to 5% in the rest years. Over the same period, the Japanese ratio is also going to experience a steady decline, from 4% to 2%.
范文原创自小站老师Jeff. Lei
字数:169 words
以上就是2018年8月11日小站雅思出品的小作文范文及解析,更多雅思写作相关资讯,请持续关注小站雅思频道。 2018年8月11日雅思小作文真题范文:柱状图


 如何制定专属雅思学习
 雅思写作冲刺之:写作
 2018雅思机考VS纸考对
 2018年雅思机考流程及
 雅思官方发布:雅思机
 2018年9月雅思口语P2
 2018年9月雅思口语P2
 2018年9月雅思口语P2
 2018年9月雅思口语P2
 2018年9月雅思口语P2
 2018年9月雅思口语P2
 2018年9月雅思口语P2
 2018年9月雅思口语P2
 2018年9月雅思口语Par
 2018年9月雅思口语Par
 2018年9月雅思口语par